Free tools for farms, food hubs, and advocates

In our fieldwork, we help partners solve problems - often by building tools and calculators with them that help figure out where they are now, and where they need to go.
Some of these solutions can be useful for others, so we turn them into general versions that all can use. We will update this page with more tools as we make them.
Have an idea for a tool, a new feature for an existing tool, or have another question about what’s here?
Delivery Cost Calculator
We developed this tool for a project in California, providing TA for four early-stage food hubs.
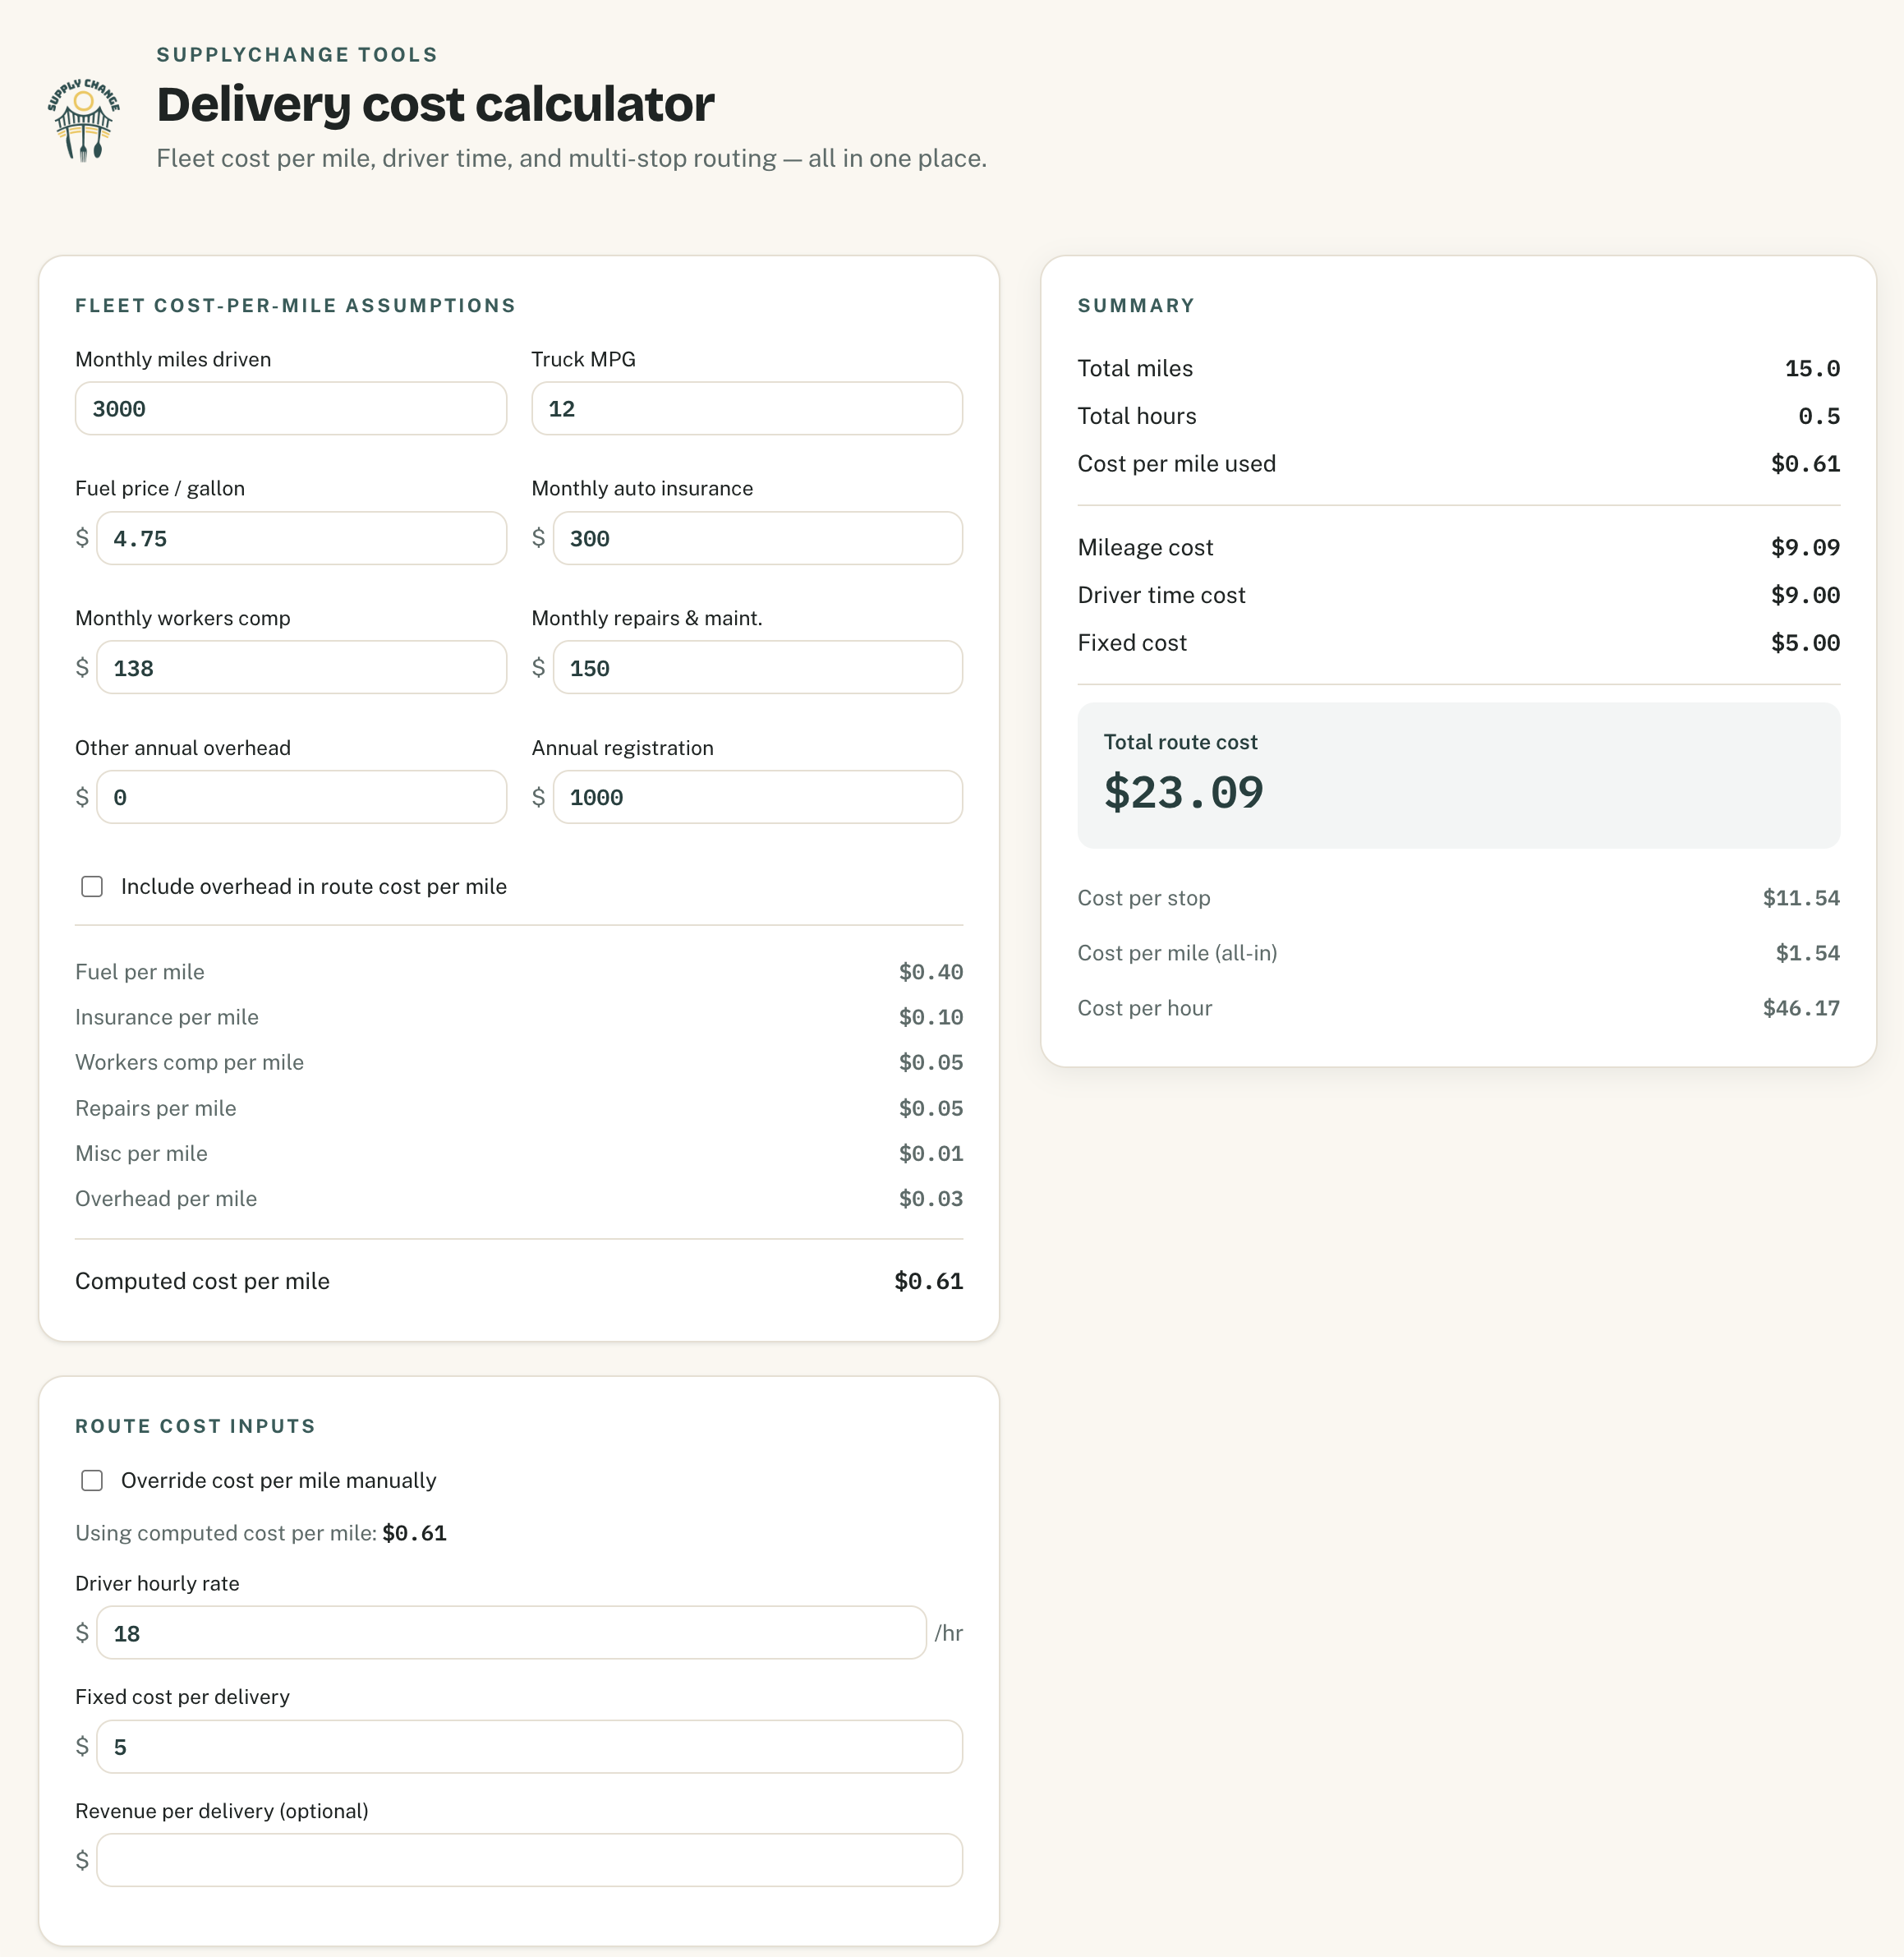
Farms and hubs can use this delivery cost calculator to make sure each delivery makes a profit.
Users can do a simple route analysis (with multiple stops), or add in fleet overhead costs, while accounting for driver labor. You can save sessions and export them to .csv, and reload them for reworking.
Future features:
map-based visual showing your selected routes
Wholesale Pricing Calculator
Originally developed for growers in the Chicago Food Policy Action Council's Farm to Institution Accelerator.
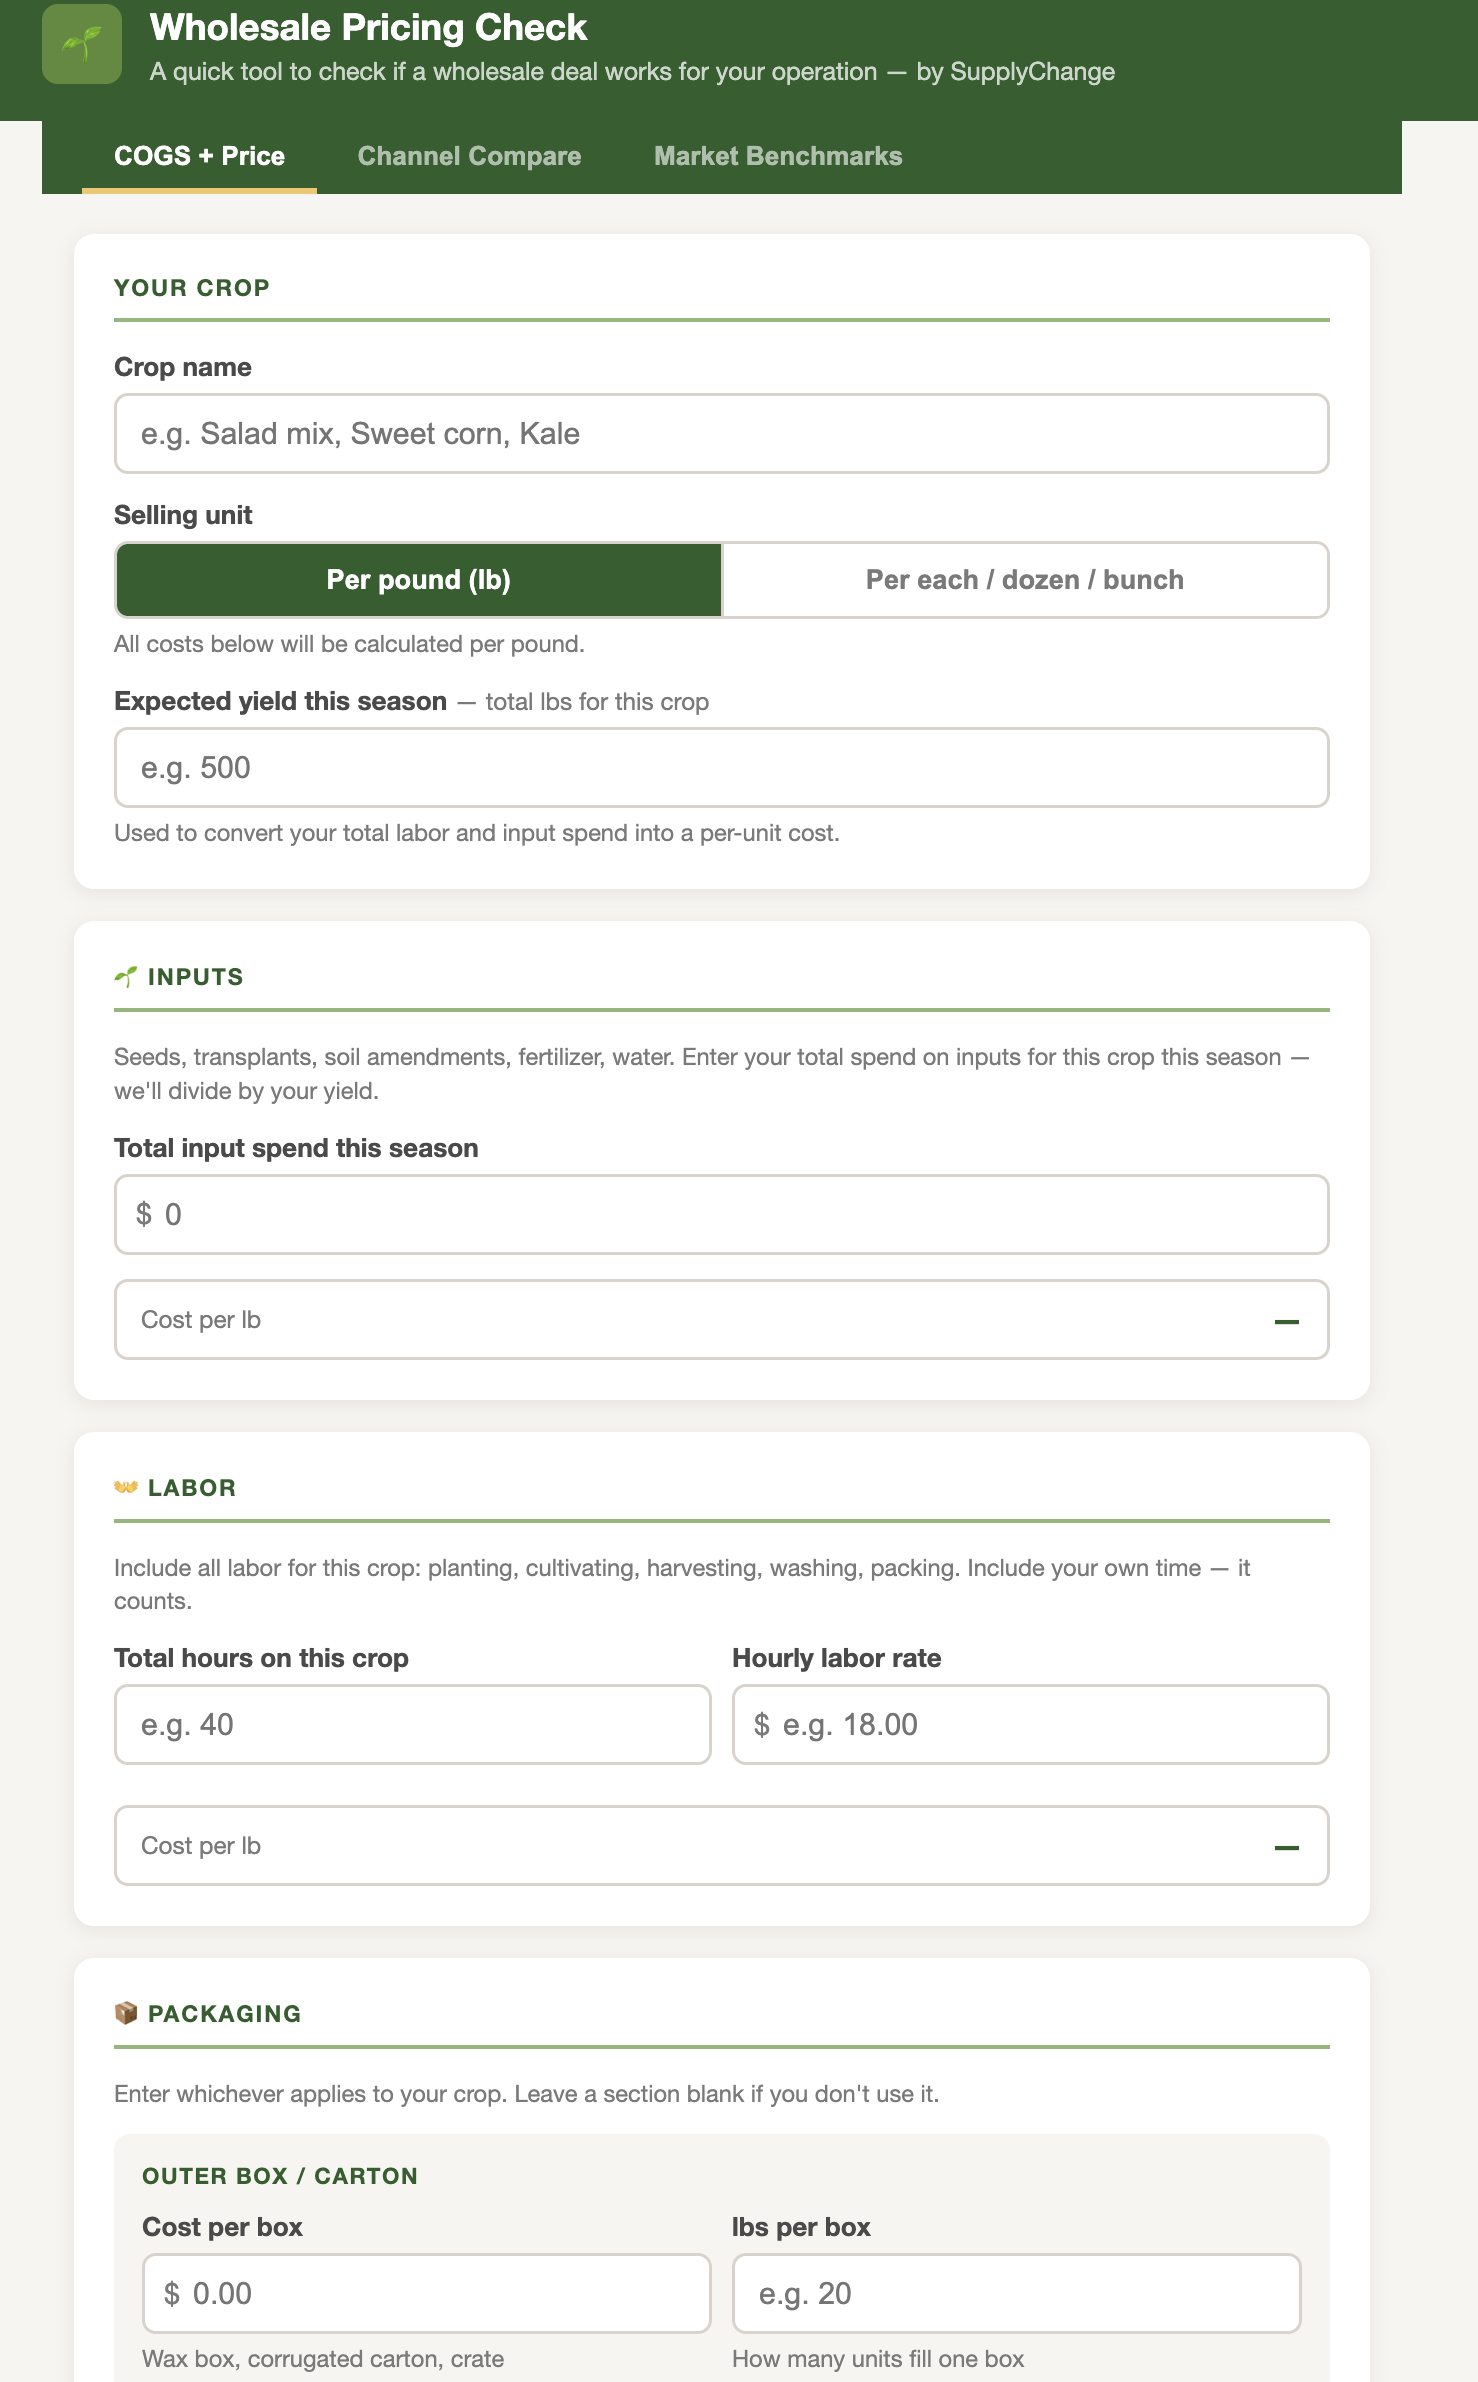
Built for small and midsized produce growers navigating institutional and wholesale markets. Enter your costs to grow, pack, and deliver a crop, and the calculator outputs your COGS, suggests a margin and markup range that keeps you profitable and competitive, and lets you compare wholesale vs. direct-to-consumer economics side by side.
The benchmarks tab* draws on anonymized pricing data we've collected from food hubs, distributors, and farms we work with across the country.
*Please note the pricing benchmarks are blended across conventional and organic, as well as all kinds of purveyors, so they are very rough averages. We are experimenting with how to break this out more meaningfully in this calculator over time. For now it’s a good gut check but not as granular as it could be.
Land to Demand Calculator
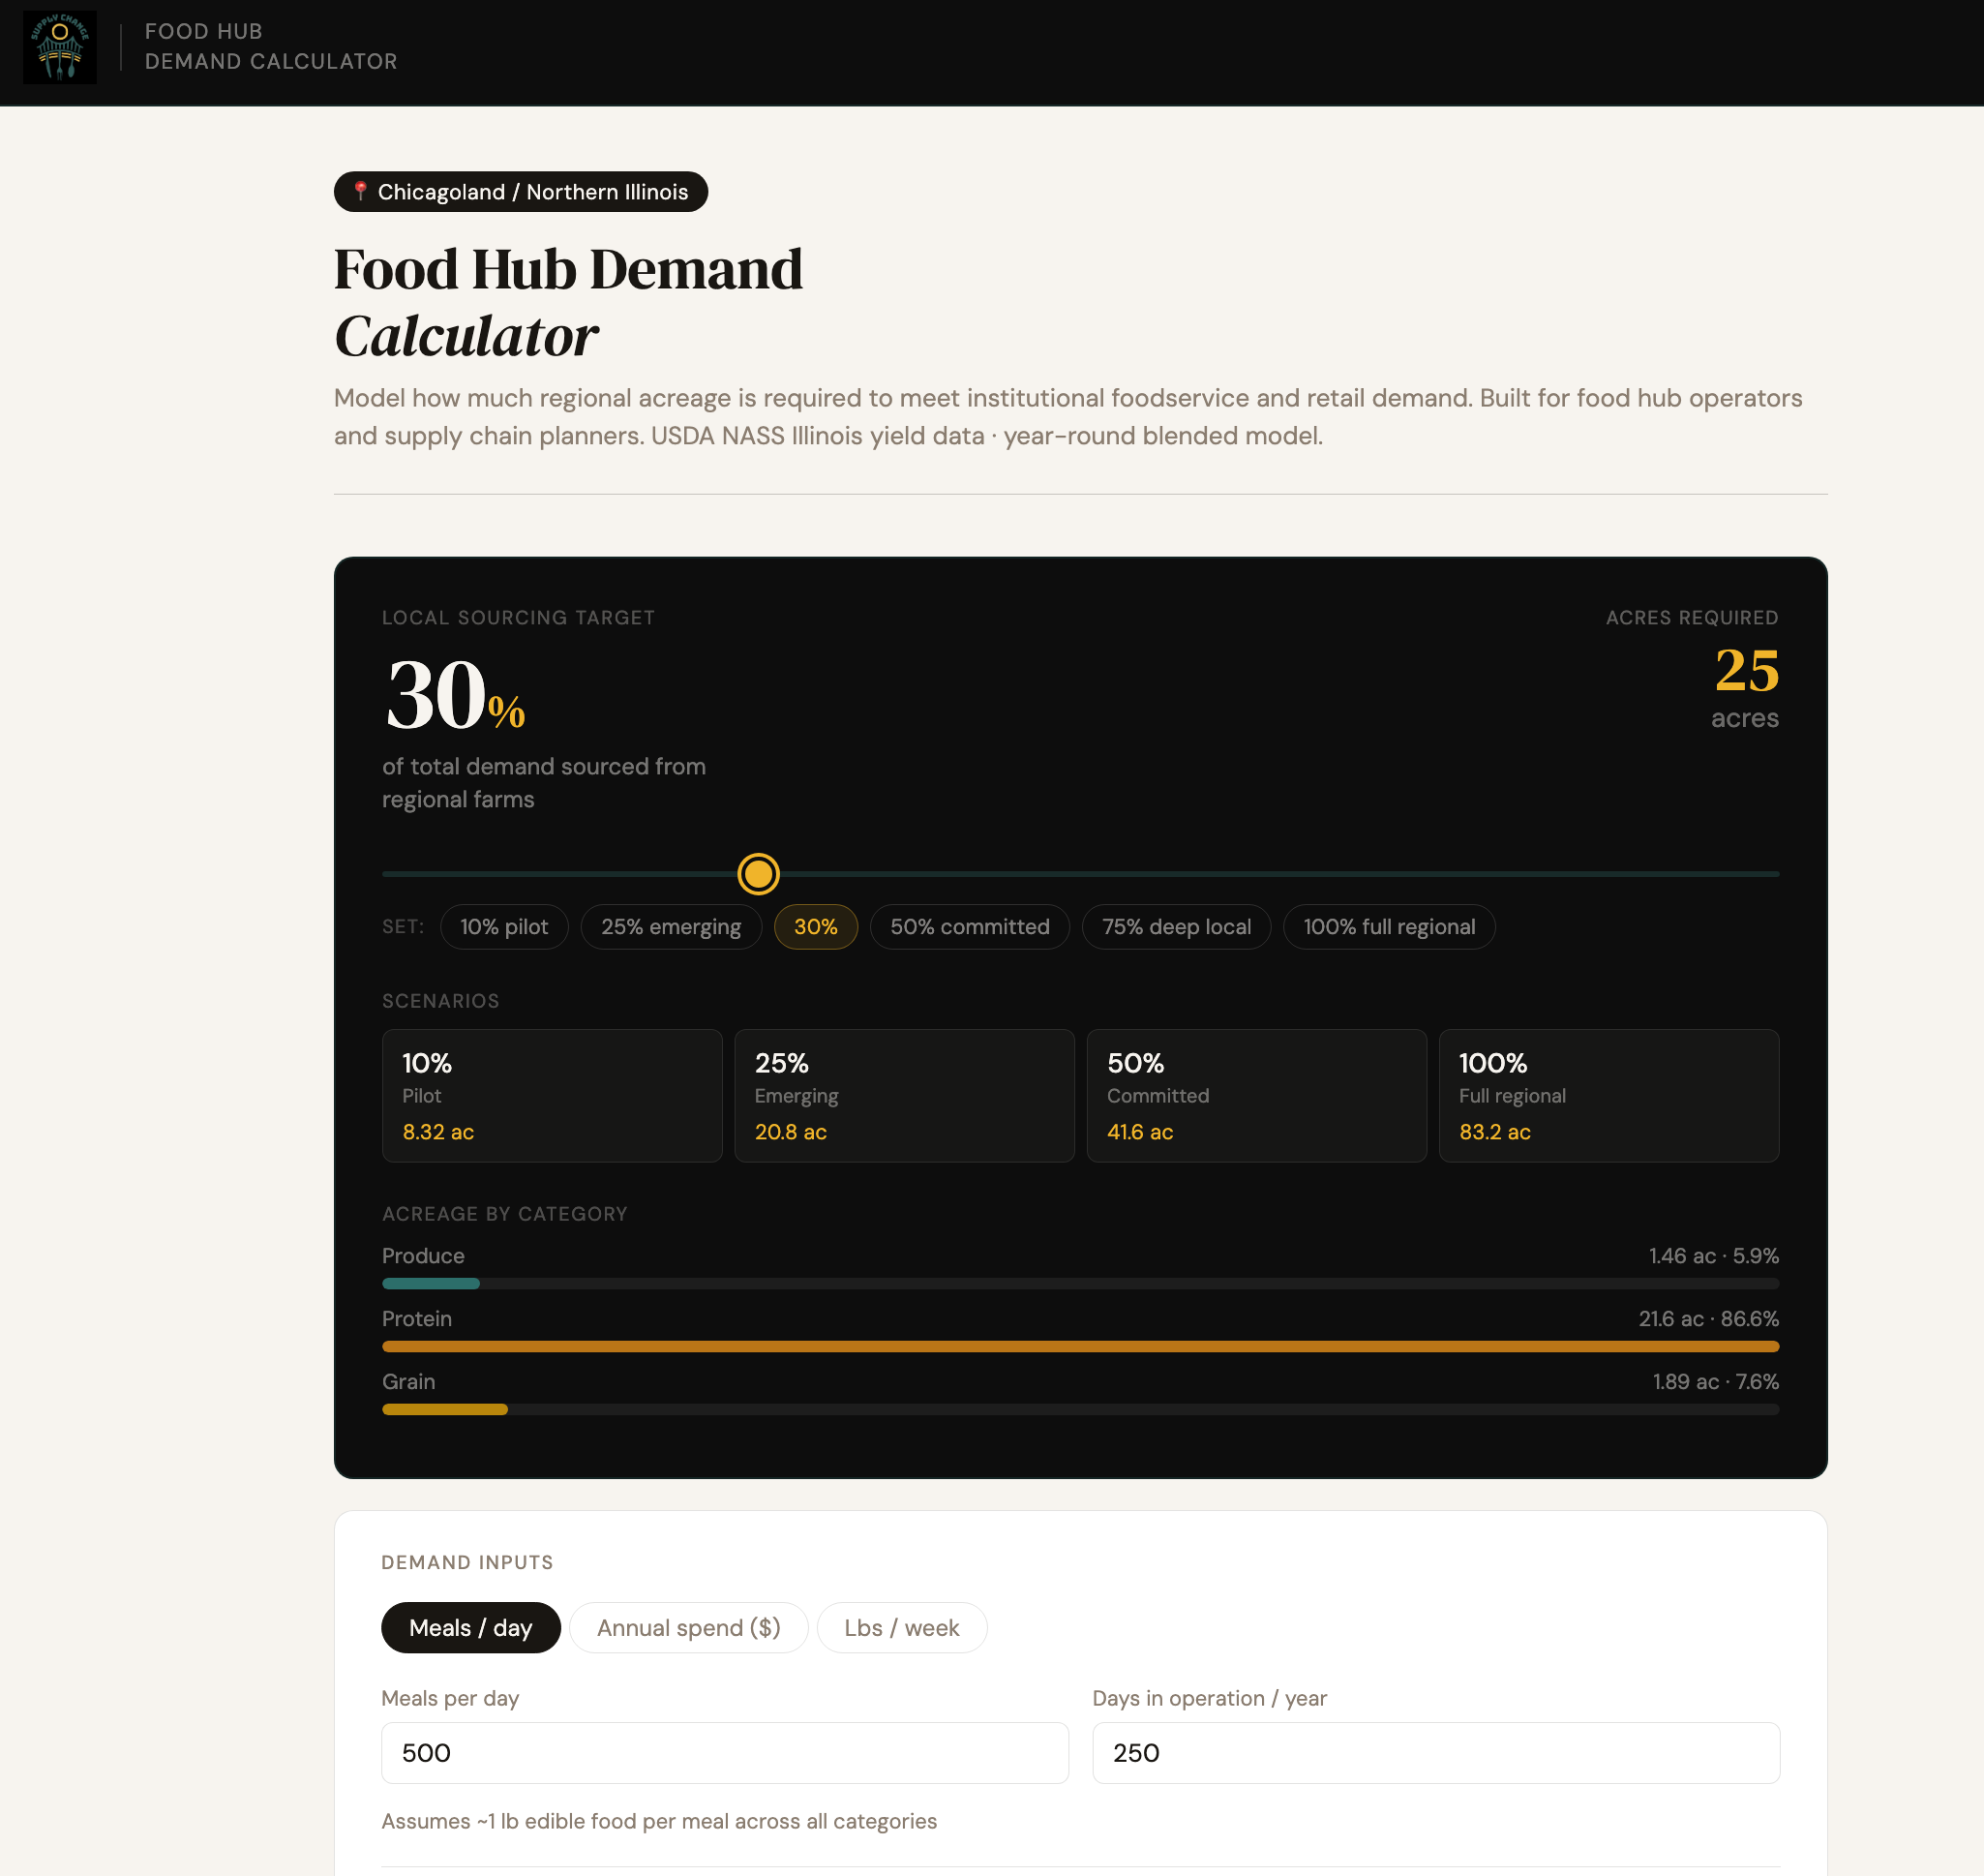
This is a developing prototype of a calculator that models the number of acres required by regional farms to supply institutional foodservice demand, using Chicagoland as a test region.
On the demand side, users can input the number of meals per day and number of days in operation for an institution, and the % institutional sourcing target - and then toggle crops grown in the region to see how many acres are required by how many farms. The crop yields are sourced from USDA yield data.
Future features:
select different regions to evaluate
more accurate yield data for small/midsize farms
more accurate crop lists from multiple food hubs and farms in each region
seasonal availability data (currently a yearly blended yield)